I Disabled Rich Pins, Here is What Happened
I turned Pinterest Rich Pins off for 28 days to measure the effect on my outbound clicks from Pinterest. Here, I share my results, plus tips on how to set up your own experiment.
Your first question is probably: Wait, what? Why would you disable the additional information that makes your Pinterest Pins look that little bit more professional?
Rich Pins display additional information on the Pin itself. Pinterest users can use this information to decide whether they want to click through to your site. And, you may end up missing out on the opportunity to convince them that your website is one they want to return to regularly.
By disabling recipe Rich Pins on my food blog, I saw a 40 % increase in my outbound click rate over consecutive 28-day periods.
Feeling a bit lost? Don’t worry, I’ll unpack my experiment clearly and help you get your own one up and running.
What are Rich Pins?
Rich Pins show metadata right on the Pin itself. The information on a Rich Pin is pulled directly from the website, independent of the title and Pin description.
There are three types of Rich Pins: recipe, article and product Rich Pins.
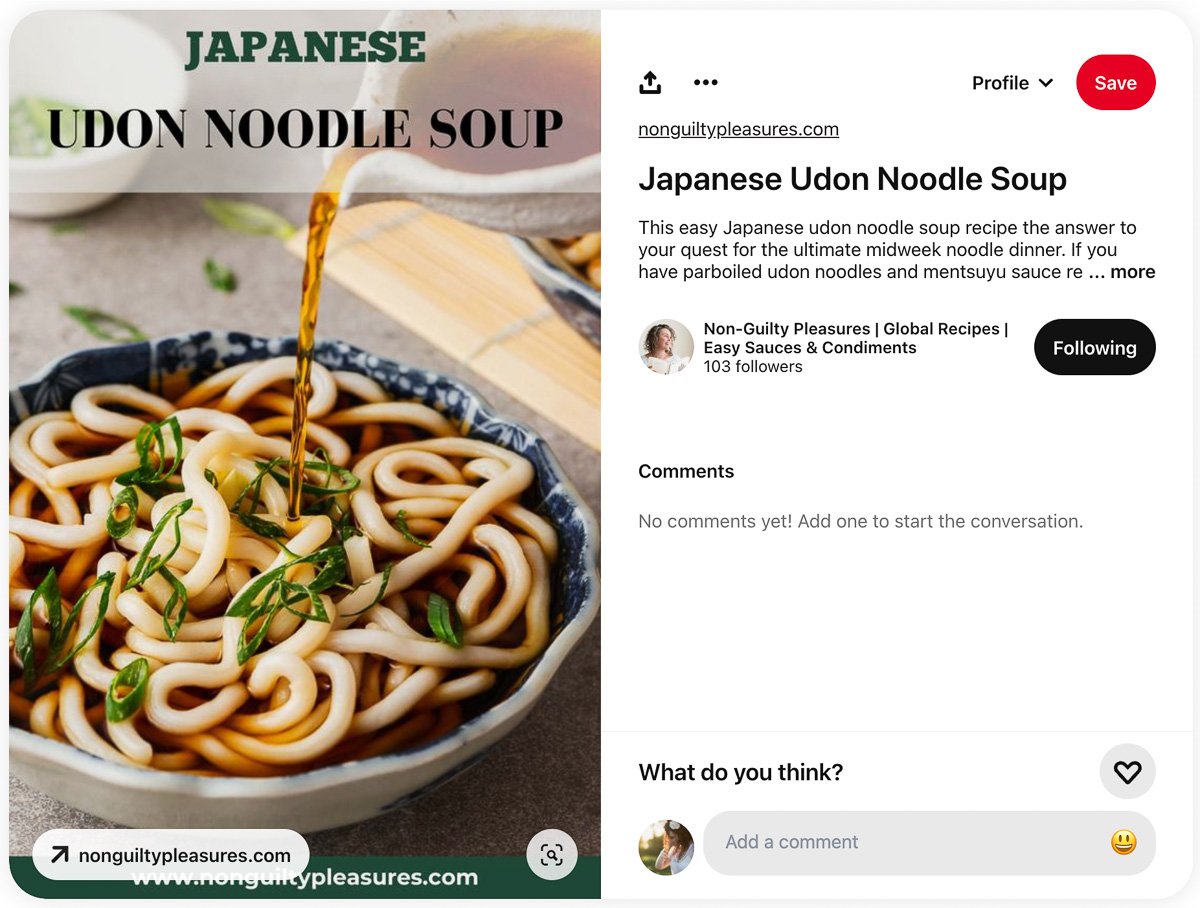
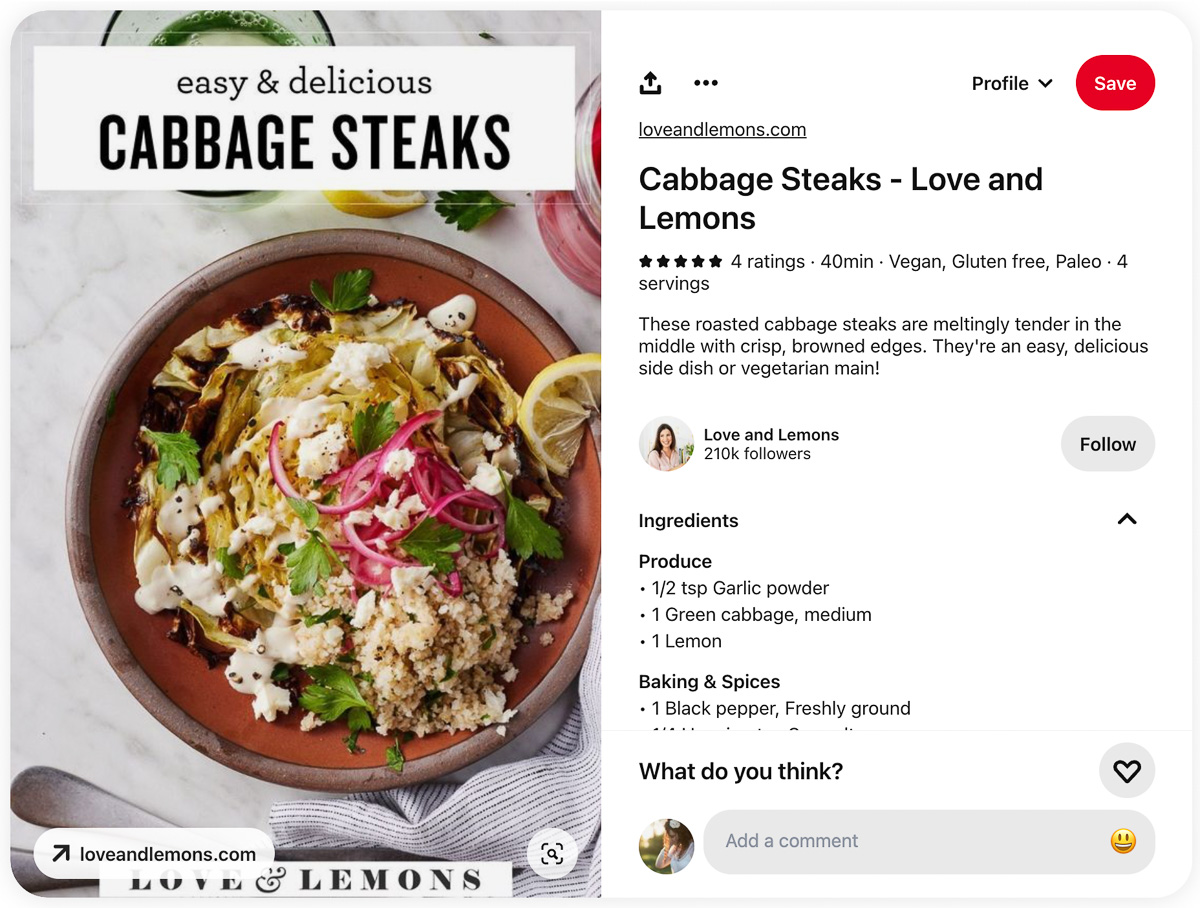
In a recipe Rich Pin, additional information like star ratings, cooking time, serving size and ingredients can be displayed.
Personally, I like seeing this information on the Pin. But, from a business perspective, I want to know how Rich Pins impact my traffic.
Rich Pin settings
When you disable Rich Pins – I use the WP Recipe Maker plugin on my WordPress website to do this – it applies to all Pins, new and old.
See it as a Pin formatting setting, it controls how all Pins originating from your website get displayed.
The Experiment
I disabled Rich Pins for 28 days while keeping the rest of my strategies in place. I want to know:
The quick answers are: I don’t know, yes, and not significantly.
But just because turning the Rich Pin setting off increased my outbound click rate does not mean the same will be true for you. I’ll provide tips for setting up your own experiment and interpreting the data.
Viewing the data
I want to see how Pins linking to my website perform when I disable Rich Pins. Turning Rich Pin data off applies to all of the Pins that link to my site whether I created a Pin with Canva, or someone else pinned directly from my website.
Disabling Rich Pins for my website has no impact on the Pins I save from other websites.
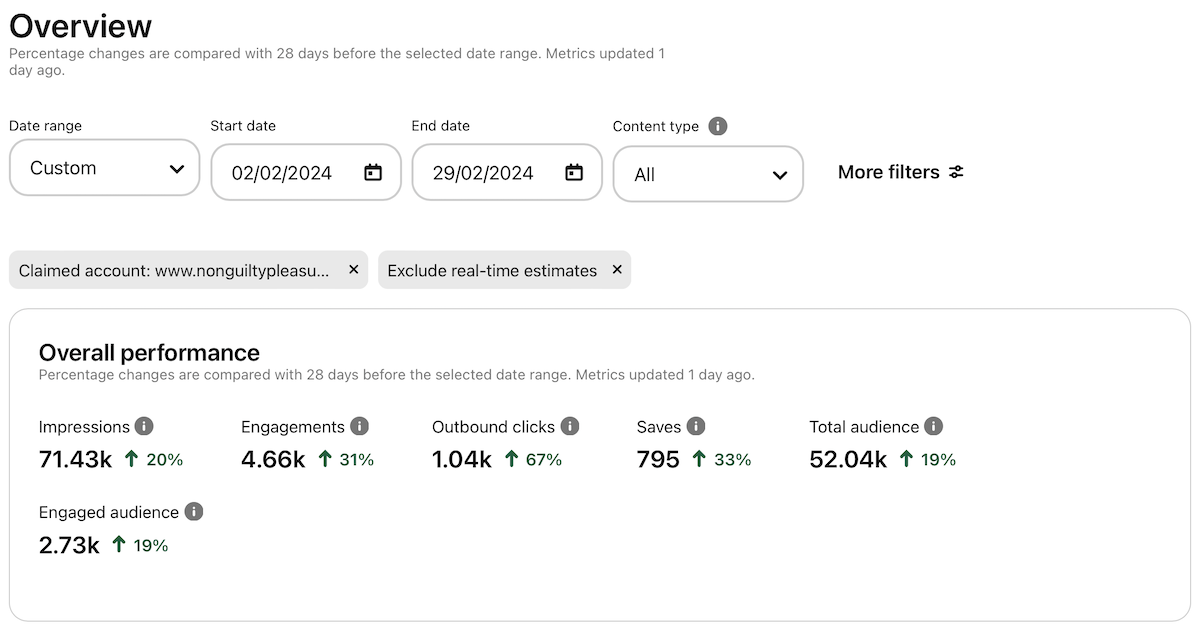
So, to create my data set on Pinterest, I set “Claimed account” to www.nonguiltypleasures.com (use your website here), “Source” to “All” and under “Data”, I left “Include saved Pins” turned off.

It is also important to turn off “real-time estimates”. We only want to look at the actual data.
You’ll find these settings under “More filters” on the Pinterest Analytics Overview page of your Pinterest business account.
For my analysis, I divided the data into buckets that are each 28 days long, excluding the day on which I flipped the switch to disable Rich Pins (1 February). I refer to the five 28-day buckets starting on 14 September 2023 until 31 January 2024 as Periods 1 to 5. And my test period stretches from 2 February until 29 February 2024.
I only have Rich Pins disabled during the test period to compare it against the preceding periods where Rich Pins were on.
Don’t worry if this sounds confusing, I only use this to illustrate how my growth changes over time. I provide instructions for a simplified version of the experiment further down.
Results: Did it impact account growth?
To measure Pinterest growth, we look at Impressions. This is a useful Pinterest metric that shows us how often our Pins are seen by others.
With the current content filters, Impressions measure how often Pinterest users see any Pin that links to my website, whether I created it myself or a user pinned it.
Whether disabling Rich Pins influenced impressions is the most difficult question to answer with conviction. There are seasonal trends in what users search for and how often they use Pinterest.
According to Kate from Simple Pin Media there is also a Pinterest off-season. While it differs by niche, the peak season for most people is from September to 15 February. The off-season is a great time to run experiments without fear of losing out on those peak-season clicks.
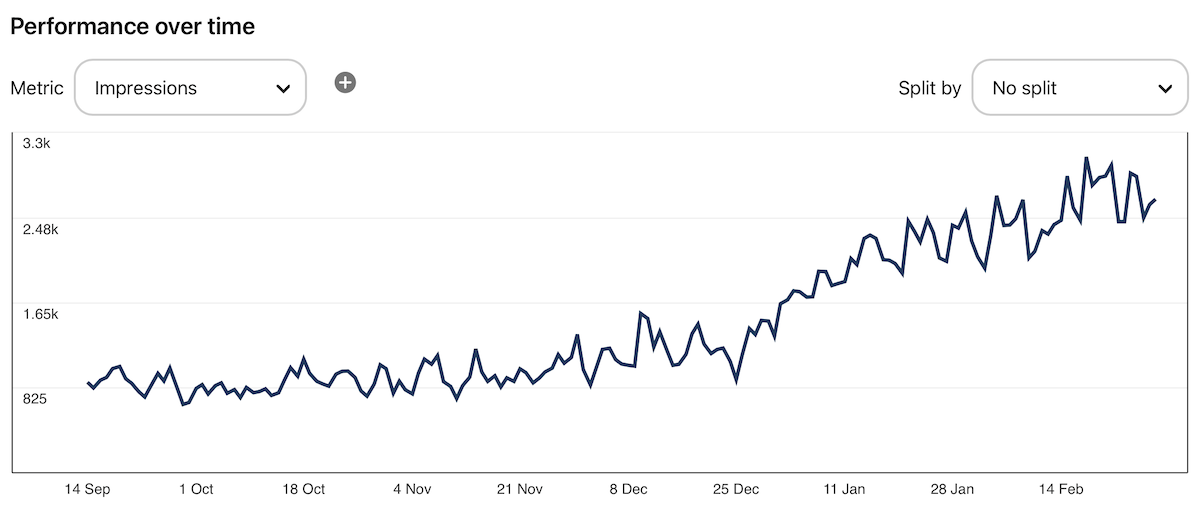
While my impressions graph shows constant improvement, the rate of growth slows down during my final test period – which happens to be as we hit the off-season predicted by Kate.
When I look at the period-on-period growth, i.e. how much my impressions grow each period based on the previous, we can see the rate of growth picking up over Period 4 (December) and Period 5 (January) and then slowing down during the test period (February).
| Period 1 | Period 2 | Period 3 | Period 4 | Period 5 | Test Period |
|---|---|---|---|---|---|
| 0.7 % | 8.7 % | 7.9 % | 30.2 % | 64.2 % | 20.9 % |
This still means that my impressions grew by 20.9 % during the test period. This is still growth. It is just much less than the 64.2 % from the previous period.
Did disabling Rich Pins lead to slowed growth?
It’s difficult to say for certain why growth slowed down:
- My Pinterest account is still fresh with too little historical data to verify my personal seasonal data trends.
- Unsustainable growth spurts in new accounts, as you pick up best practices, make complete sense.
- These impressions include recipe Pins created by others that link to my website. And the peak holiday cooking season (Q4) just ended.
- I could simply be reaching my Pinterest off-season.
Is this bad?
I’m not worried. As long as I’m seeing growth, I’m happy to keep the experiment running. In a few months, I will turn Rich Pins on again and measure the impact in the same way.
Besides, the next question is the big one.
Results: Did users click through more often?
This is the burning question. At the end of the day, we want our monetised blogs to receive traffic from Pinterest.
So, I want to know how often users click through to my site after seeing a Pin. Luckily, Pinterest has just the metric. It’s called outbound clicks.
Pinterest defines outbound clicks as “the number of times people perform actions that lead them to a destination off Pinterest”.
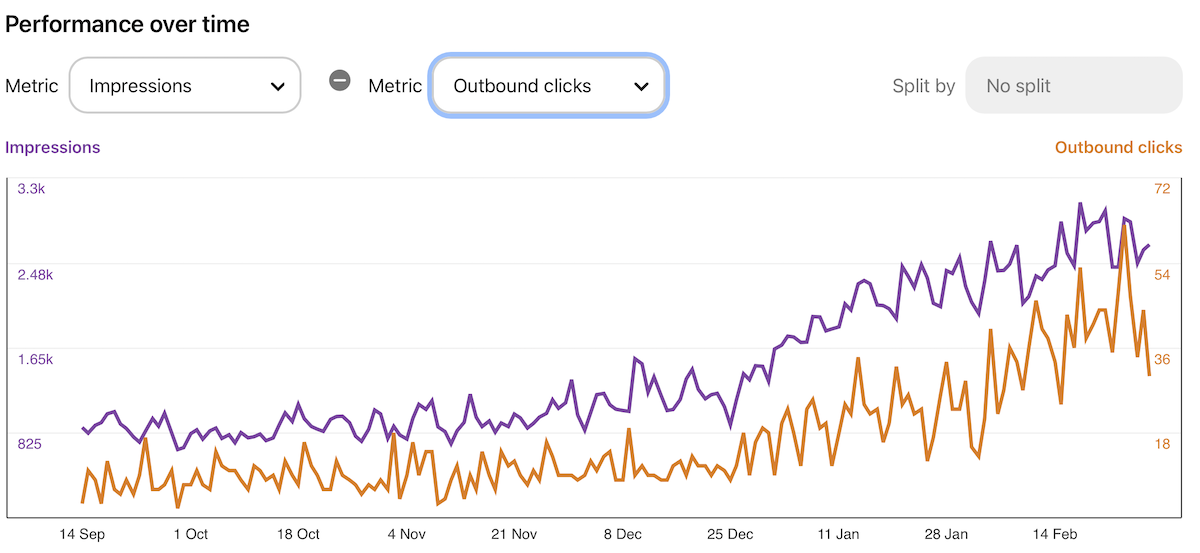
In this Pinterest Analytics graph, we can see impressions and outbound clicks growing steadily. My outbound clicks increased by 67 % over the two test periods. BUT, I am in a growth phase.
We want to answer the question: Are users more likely to click through to a site without Rich Pins?
So, what we really want to know is how our outbound clicks performed relative to impressions. When you look closely at the graph, you can see the gap between the two lines becoming smaller right at the end – during the test period in February where Rich Pins are disabled.
This means that more users clicked through to the site relative to the number of users who saw the Pins. This is good!
And there is no need to squint at graphs, Pinterest actually gives us a metric to measure this – it’s called outbound click rate. Pinterest defines outbound click rate as “the total number of clicks to the destination URL associated with your Pin divided by the total number of times your Pins were on screen”. See more Pinterest metric definitions.
The outbound click rate tells us how often a user presented with a Pin ends up clicking through to the site on average. This is exactly what we want to know!
| Period 1 | Period 2 | Period 3 | Period 4 | Period 5 | Test Period |
|---|---|---|---|---|---|
| 0.9 % | 1.0 % | 1.0 % | 0.9 % | 1.0 % | 1.4 % |
My normal outbound click rate for all Pins is around 0.01 (1 %) – it includes Pins created by others via my site. This means that if a Pin gets 100 impressions, on average I get one click to my site.
When I disabled Rich Pins, my outbound click rate went from 0.01 (1 %) to 0.014 (1.4 %). It sounds insignificantly small, but that’s a 40 % increase in the outbound click rate.
My Pinterest account is small fries, but when you look at huge accounts, like Natasha’s Kitchen, which gets 10m+ monthly views, the difference in traffic is potentially significant. On 10,000,000 impressions, an outbound click rate increasing from 1 % to 1.4 % results in an estimated traffic gain of 40,000 clicks per month – if the impression stay the same.
Results: What about on-page metrics?
When I disabled recipe Rich Pins, users were more likely to click through to my site. The theory is that users are less likely to click through to your website if you already show them the ingredients in the Rich Pin.
So, if we remove this information, will people only click through to see the ingredient list or do they actually engage?
We want to drive traffic to our sites, but ideally, we want people to engage with our content and stick around. We want time to convince first-time visitors to stick around and become regular readers, and, of course, we want eyes on ads.
Google Analytics is not a great tool for measuring traffic from Pinterest as the page views are often not correctly attributed. Fortunately, Microsoft Clarity is a free tool that does a much better job of tracking Pinterest traffic.
| Pages Per Session | Scroll Depth | Active Time | Total Time | |
|---|---|---|---|---|
| Period 5 | 1.13 | 49.75 % | 3.1 min | 4.4 min |
| Test Period | 1.37 | 42.74 % | 3.0 min | 4.5 min |
I saw a slight decrease in active time on site for the test period, but this metric fluctuates because of many other factors, including site design. So, given how small the change is, I won’t lose sleep over this metric.
The active time from the test period for Pinterest referral data is still significantly higher than other sources. My Google-referred sessions for the same period have an average active time of only 1.8.
Run your own Rich Pins experiment
- Pick your start date – ideally during your Pinterest off-season.
- Turn off Rich Pins – I did this using my WP Recipe Maker settings.
- While running your experiment, don’t make changes to your Pinterest strategy or pin design – both can impact the outbound click rate.
- To measure the effect, update your content filters in Pinterest Analytics Overview on desktop:
- Real-time data: Leave “Use real-time estimates” unselected
- Claimed account: your website
- Source: All
- Data: Leave “Include saved Pins” unselected
- View metrics by selecting the date range, starting on the day you disabled Rich Pins.
Analyse your results
Pinterest compares the data from the data range you selected to the previous period of the same length. You’ll see the results in the “Overall performance”.
To get your average outbound click rate, you’ll need to select it in the “Performance over time” section. The results will display a graph and you’ll find the “Average outbound click rate” for this period shown below the graph.
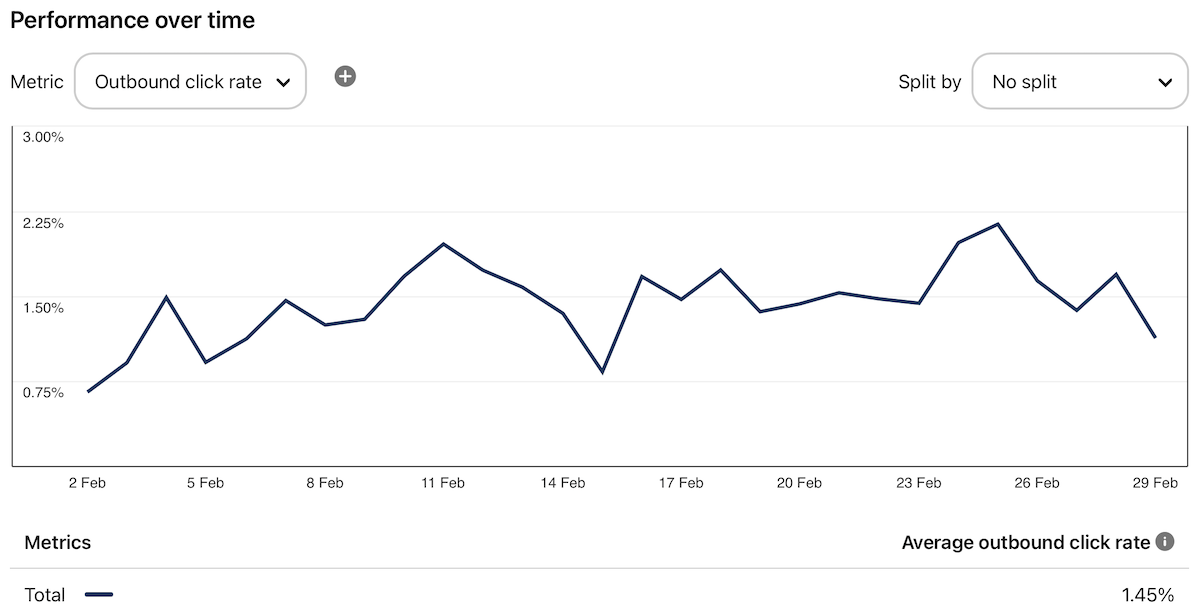
Compare the average outbound click rate to the previous period manually. If you are looking at two weeks of test result data, select the two-week date range that directly precedes your experiment. Compare the average outbound click rate to see if your outbound click rate is going up or down.
While you run your experiment, keep an eye on your website traffic and on-page metrics.
Unless your Pinterest impressions or outbound clicks start to plummet, try to keep the experiment going for at least two to four weeks before you make assumptions.
Results Summary
I saw an increase of 67 % in outbound clicks, but more specifically an increase of 40% in the outbound click rate. The large increase in outbound clicks is not out of the norm for my growing Pinterest account. However, the increase in outbound click rate growth (normally very stable) indicates that pinners are more likely to click through to my website when they don’t have all of the metadata in the Rich Pin.
While my Pin impressions grew by 20.9 %, the impression growth is less than the previous 28-day period.
The question remains: Is this due to my Pinterest off-season or is it caused by disabling Rich Pins? If disabling Rich Pins leads to fewer impressions, it needs to be balanced with the increase in outbound click rate.
And, finally, disabling Rich Pins had no significant impact on my on-page metrics (or MediaVine RPM).
So, for me, for now, I am keeping Rich Pins disabled. But, I will rerun this experiment in a few months by enabling Rich Pins to see if the inverse is also true.
But, just because it worked for me, doesn’t mean you will see the same results. So, I encourage you to monitor your metrics as you run your own experiment.
Want to see more like this?
I thoroughly enjoyed creating this post. And, if you found it helpful, or have any questions, please leave a comment! I would love to hear from you.
Are you planning on running this experiment? Are you willing to share your data? Contact me, I’d be happy to do your analysis in exchange for the data!